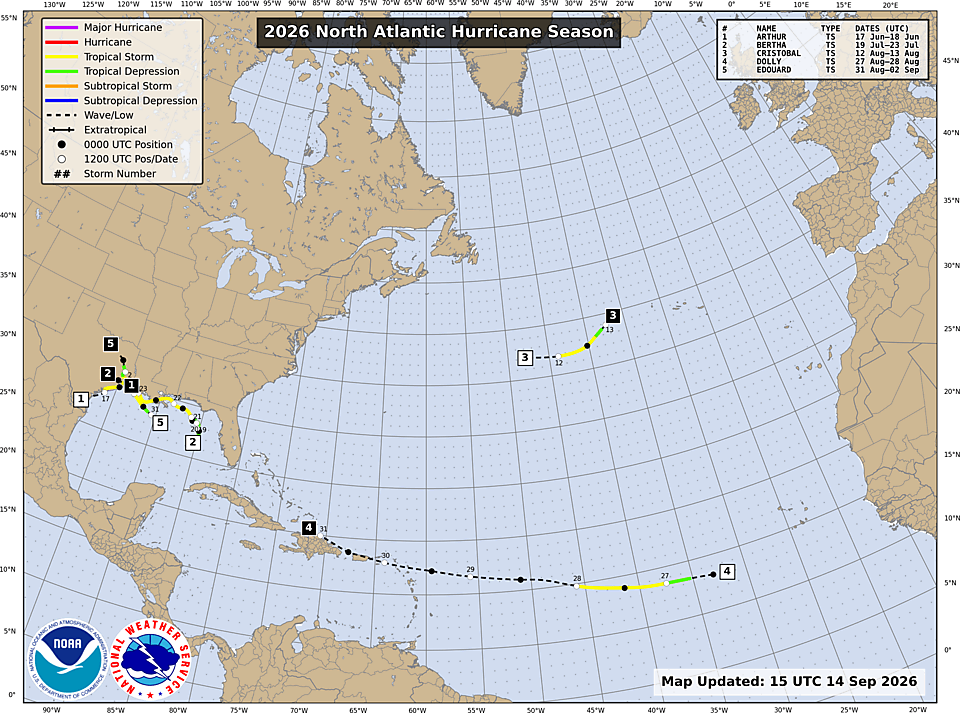
The 2026 Atlantic hurricane season has developed unusually quietly. As of September 14, the Atlantic had produced five named storms and no hurricanes. Accumulated Cyclone Energy (ACE) stood at 4.4, approximately 93% below the 1991-2020 normal for this point in the season.
September 10 marks the climatological peak of Atlantic hurricane activity. It is the point at which tropical cyclone activity has historically been most concentrated, with most Atlantic activity occurring between mid-August and mid-October.
For the reinsurance market, conditions through this year's peak have been favorable. They also provide a useful opportunity to explain how hurricane activity translates into reinsurance risk, and how OnRe constructs and capitalizes a portfolio through periods when catastrophe exposure is at its highest.
What a quiet hurricane season actually means
Storm counts provide only one view of hurricane activity.
ACE is designed to capture both the intensity and duration of tropical cyclones. NOAA calculates it as the sum of the squares of the maximum sustained surface wind speed, measured every six hours for named storms while they are at least tropical-storm intensity. Longer-lived and more powerful storms therefore contribute more ACE than weaker, short-duration systems.
The 1991-2020 Atlantic average is approximately 14 named storms, seven hurricanes, and three major hurricanes over a full season. The exceptionally low ACE recorded so far in 2026 indicates that the basin has experienced relatively little sustained cyclone activity by historical standards.
.png)
For reinsurers exposed to Atlantic windstorm, that represents favorable loss experience through an important part of the annual risk period.
The relationship between hurricane activity and insured losses, however, depends on considerably more than the number or intensity of storms in the basin. A hurricane can generate significant ACE while remaining over open water and produce little insured loss. Another can develop during an otherwise quiet season and cross an area with dense concentrations of insured property.
Landfall location, insured values, construction characteristics, policy terms, and the structure and attachment point of reinsurance coverage all influence the eventual loss.
Hurricane Andrew remains one of the clearest historical examples. The 1992 Atlantic season was relatively quiet, but Andrew struck South Florida as a Category 5 hurricane and became the largest insured catastrophe loss recorded at the time. Its impact contributed to major changes in catastrophe modeling, underwriting, and the structure of the property catastrophe reinsurance market.
This distinction between meteorological activity and financial exposure is central to catastrophe underwriting. Seasonal statistics provide useful information about the hazard environment. Reinsurance portfolios are built around the potential loss associated with the exposures being assumed.
Catastrophe risk extends well beyond Atlantic hurricane
Atlantic hurricane represents a major concentration of insured catastrophe exposure, but it sits within a much broader natural catastrophe market.
Earthquake, severe convective storm, wildfire, flood, winter storm, and other natural perils each have different geographic footprints, seasonality, and loss characteristics. These risks can produce substantial insured losses independently of Atlantic hurricane activity.
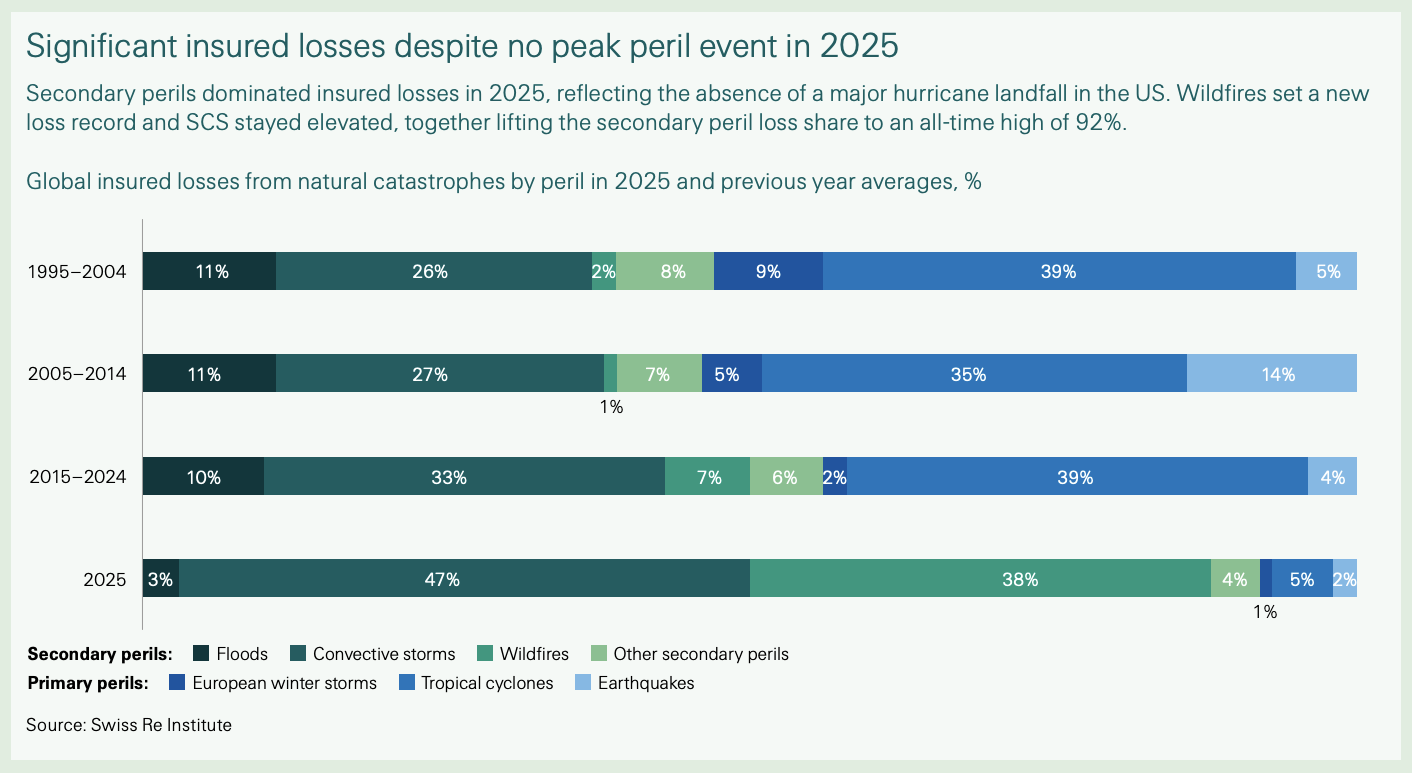
Global natural catastrophes generated $107 billion of insured losses in 2025, according to Swiss Re Institute. The year was notable for the absence of a major U.S. hurricane landfall, yet insured losses remained above $100 billion for the sixth consecutive year.
The composition of those losses was particularly significant.
The Los Angeles wildfires generated approximately $40 billion of insured losses, making them the largest insured wildfire event on record. Severe convective storms generated approximately $51 billion globally, marking the third consecutive year in which insured losses from the peril exceeded $50 billion.
Wildfires, severe convective storms, and floods together accounted for 88% of global insured natural catastrophe losses in 2025.
The pattern has continued into 2026. During the first half of the year, natural catastrophes generated an estimated $142 billion of economic losses and $46 billion of insured losses globally, according to Gallagher Re. Thirty individual events produced at least $1 billion of economic loss and eleven produced at least $1 billion of insured loss.
Those totals were below long-term averages, but they were distributed across a broad range of events, including severe convective storm activity in North America and the Venezuela earthquake sequence.
For a reinsurer, these events are viewed as components of an aggregate risk portfolio. The performance of one peril or geography provides only part of the overall picture.
How diversification works in a catastrophe portfolio
Diversification is a core component of OnRe's underwriting approach.
The portfolio is constructed across different insurance risks, perils, geographies, counterparties, and contract structures. Each dimension changes the way the portfolio responds to an event.
Geographic diversification reduces concentration in any single region. Peril diversification spreads exposure across risks whose underlying loss drivers differ. Contract structure and attachment points determine when coverage responds and how much capital can be exposed to a particular loss. Even two contracts covering the same peril can behave very differently.
A hurricane-exposed position covering one geographic area may have limited overlap with a position covering another. A layer attaching at a higher loss threshold responds to a different severity of event than a lower-attaching layer. Short-duration contracts also allow exposures to mature and capital to be reassessed as market conditions change.
OnRe's property catastrophe exposure includes structures such as Industry Loss Warranties (ILWs) and excess-of-loss reinsurance. ILWs respond when independently measured industry losses from a defined event exceed a contractual threshold, while excess-of-loss coverage responds when losses exceed a specified attachment point under the terms of the contract. These structures allow risk to be defined and capped contractually.
At the portfolio level, the objective is to understand how each new exposure interacts with the existing book: where exposures overlap, where diversification is added, how much capital is at risk under different scenarios, and whether the premium received appropriately compensates for that risk. This process determines the shape of the portfolio well before an event occurs.
.png)
Capital protection through peak peril periods
Portfolio construction determines the risks OnRe assumes. Capital management supports those obligations throughout the life of the contracts.
OnRe operates as a fully licensed, fully collateralized reinsurer. Capital supporting reinsurance obligations is funded in advance, and OnRe's segregated account structure legally separates the assets and liabilities supporting individual programs.
For catastrophe exposure, this matters because losses can be concentrated over relatively short periods. Capital allocated to the portfolio therefore extends beyond capital actively supporting underwriting positions. OnRe maintains dedicated reserves and a liquidity layer alongside underwriting exposure, with each serving a defined role in the broader capital structure.
Reserves account for expected claims and obligations associated with the insurance portfolio. The liquidity layer maintains additional available capital and supports the system's liquidity requirements. Capital backing reinsurance contracts remains committed according to the terms of those contracts throughout their risk periods.
During peak peril periods, this structure maintains protection against catastrophe volatility while preserving the capital required to support the portfolio.
Capital does not have to be placed into a new underwriting opportunity simply because it is available. The expected return, modeled risk, attachment point, duration, concentration, and effect on the existing portfolio all inform whether an opportunity improves the book. Maintaining capital in reserve can therefore be as important to the portfolio as deploying it.
Underwriting in a well-capitalized reinsurance market
That selectivity is increasingly relevant in the current market.
Global dedicated reinsurance capital reached a record $688 billion during the first half of 2026, according to Gallagher Re, an increase of 5% during the period. Traditional reinsurance capital reached $541 billion, while non-life alternative capital grew 9% to $147 billion.
The growth in available capital has contributed to more competitive property catastrophe conditions. Guy Carpenter's Global Property Catastrophe Rate-on-Line Index declined 16% at the 2026 mid-year renewals, following several years in which property catastrophe pricing had risen substantially.
For capital providers, changing pricing affects the return available for assuming a given amount of catastrophe risk. For reinsurers, it increases the importance of selecting exposures where pricing, structure and portfolio fit remain attractive.
OnRe evaluates underwriting opportunities within that context.
Risk is modeled at the contract level and considered within the aggregate portfolio. Capital can be allocated where the expected return appropriately compensates for the exposure being assumed, while reserves and liquidity remain available to protect the broader book. The ability to remain selective is itself a feature of a well-capitalized portfolio.
Building through the cycle
The Atlantic has experienced historically low hurricane activity through the climatological peak of the 2026 season. For communities, insurers and reinsurers exposed to Atlantic windstorm, the experience to date has been favorable. It also demonstrates why catastrophe risk is managed at the portfolio level.
Individual seasons vary. The sources of insured catastrophe loss vary with them. In 2025, wildfire and severe convective storm losses dominated a year without a major U.S. hurricane landfall. During the first half of 2026, $46 billion of insured natural catastrophe losses occurred across a range of events.
OnRe's approach is built around that variability.
Diversification across perils, geographies, and structures limits dependence on any single source of catastrophe risk. Disciplined underwriting determines which exposures enter the portfolio and at what terms. Full collateralization, dedicated reserves, and liquidity provide protection throughout the periods when those exposures are active.
The favorable development of the Atlantic season to date is one part of the portfolio's performance. The underlying strength comes from how the book was constructed and capitalized before the season began.
.png)
.png)
.png)